Tools for Inspecting HTTP Requests
Table of Contents

The are many tools available for inspecting HTTP requests and responses, which can be useful for debugging and understanding how web applications work. These tools allow you to analyze the data being sent between clients and servers, view headers, and inspect the response bodies. Here are some popular tools for inspecting HTTP traffic:
Browser Developer Tools #
Use the browser developer tools for the browsers ‘point of view’ of the HTTP request and response.
Many modern browsers have built-in developer tools that allow you to inspect the HTTP requests and responses made by the browser when loading a webpage.
Since the tool is embedded in the browser, it can provide additional information and insight about the webpage’s structure, performance, and resources. You can view the network activity, inspect the HTML, CSS, and JavaScript.
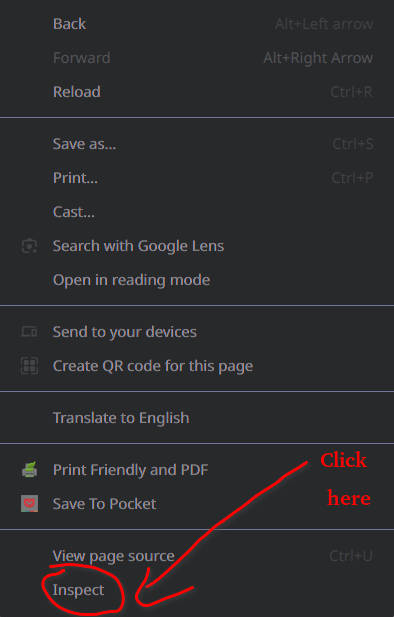
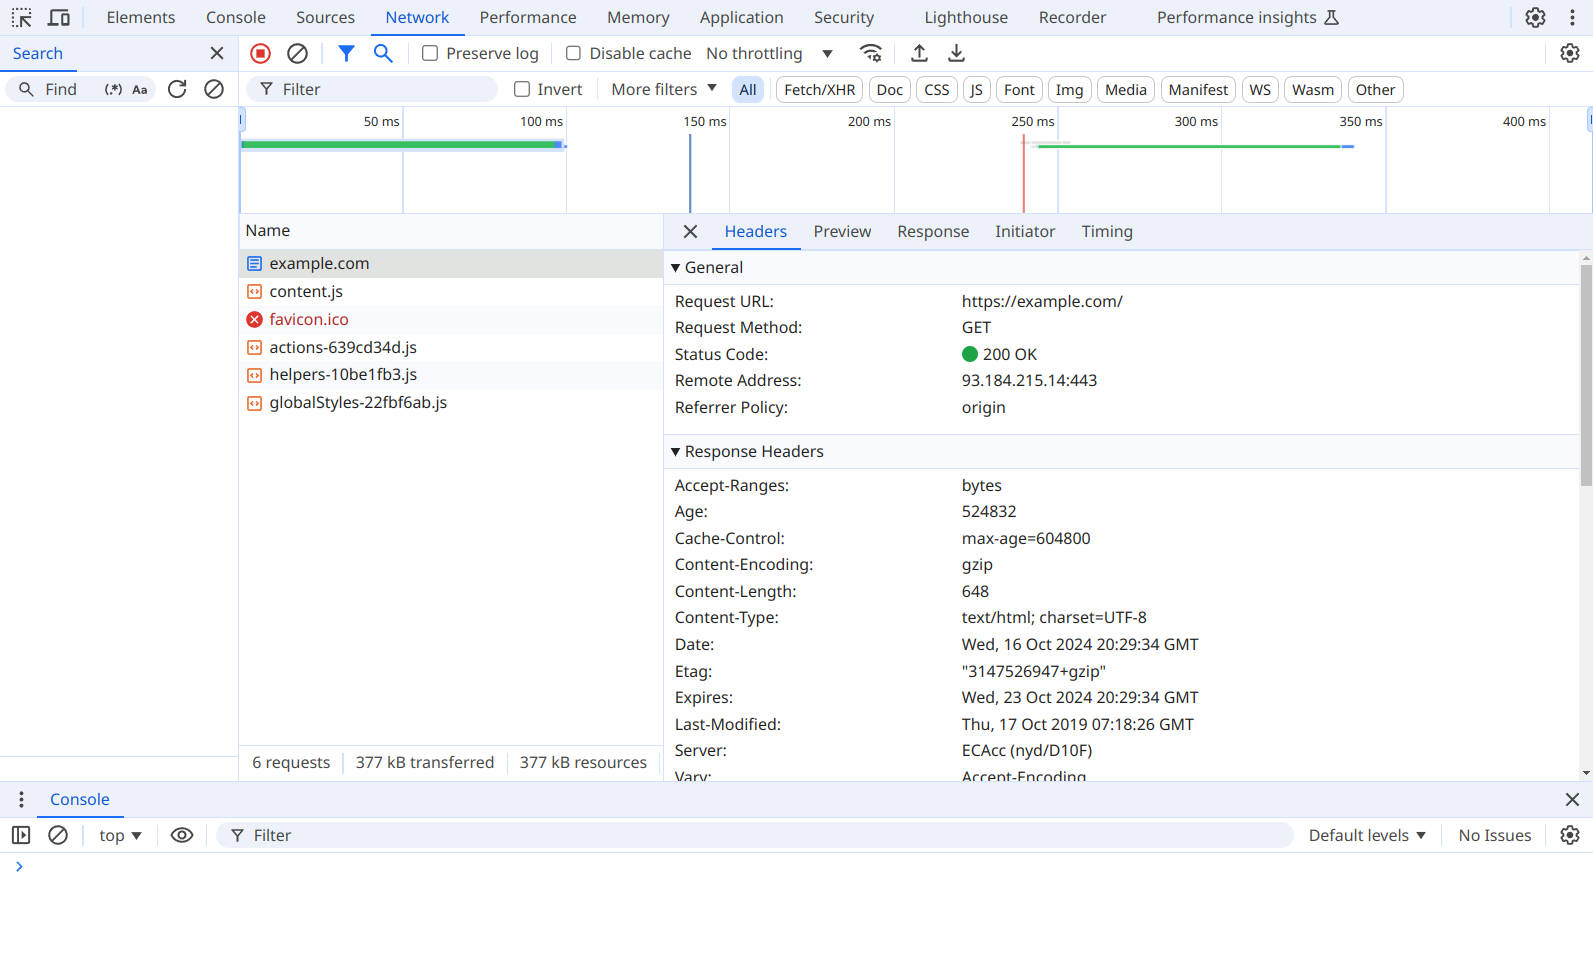
For chrome, you can right-click on a webpage and select “Inspect” to open the developer tools. Then, navigate to the “Network” tab to see the HTTP requests and responses made by the browser. You can filter requests by type, view headers, and inspect the response body to understand how the webpage is loaded.
Postman #
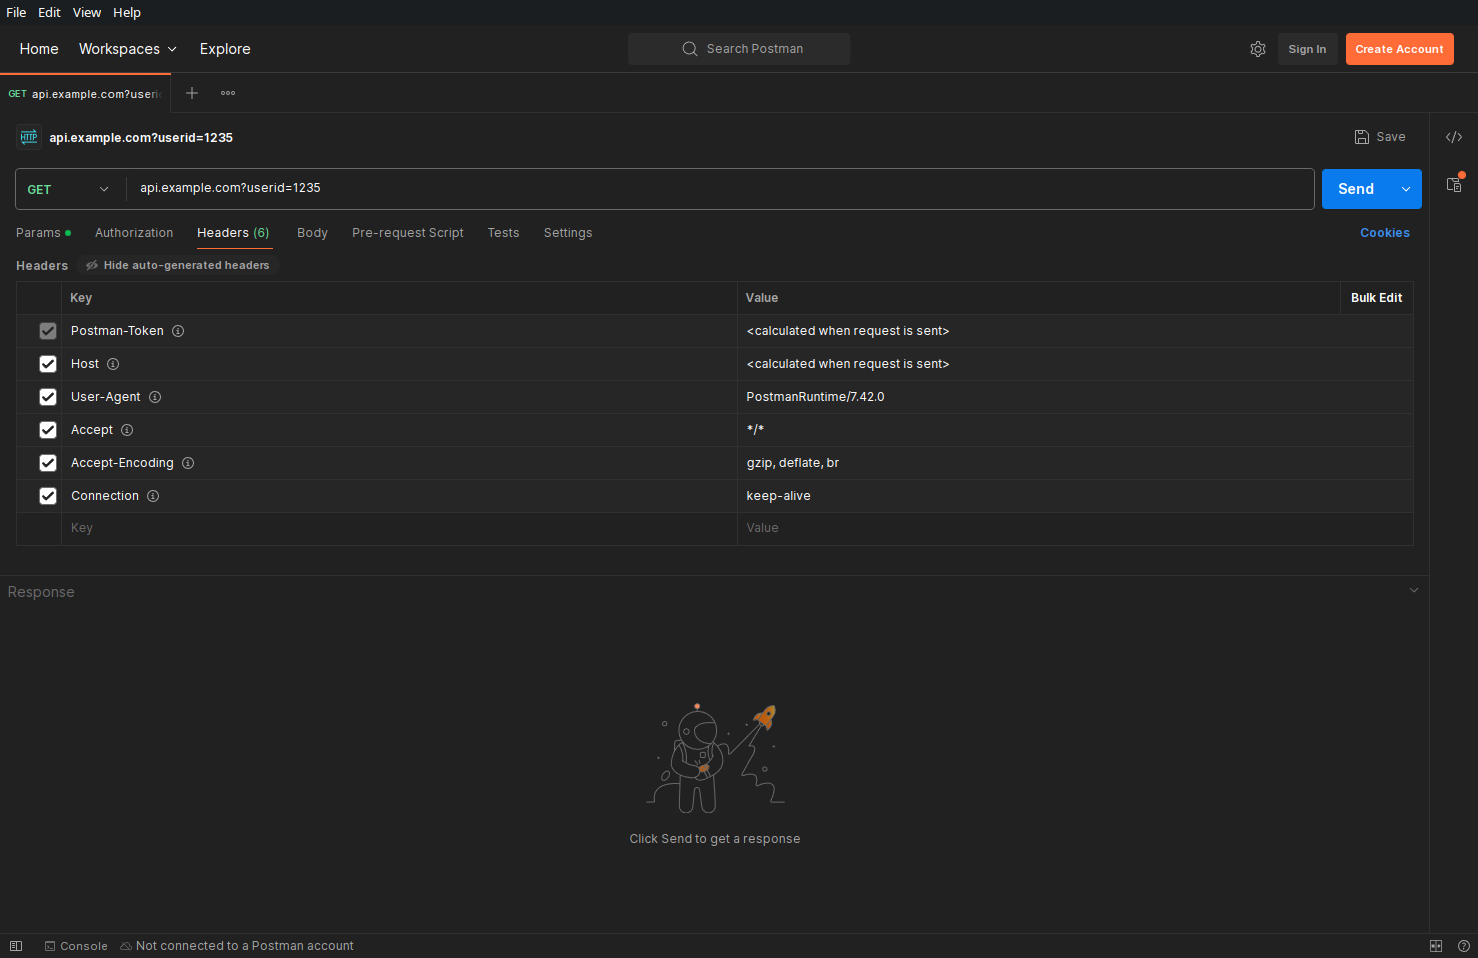
Use Postman to test APIs using a user-friendly interface
Postman offers a user-friendly interface with a clean design, making it easy for developers and testers to navigate. Its robust API testing capabilities allow for both manual and automated testing, making it a versatile tool for different workflows. Postman supports various HTTP methods, headers, parameters, and authentication types, enabling efficient management of API requests and responses.
Postman excels in collaboration by allowing teams to share collections, manage roles, and integrate seamlessly with tools like version control and CI/CD pipelines for smooth workflow automation. It also provides features for generating API documentation, simulating endpoints with mock servers, and monitoring API performance.
It also has the ability to store and organize requests, run tests, automate workflows and convert requests to code such as cURL, JavaScript, Python, and more.
Depending on your needs, Postman can be run a standalone application, as a browser extension, or as a command-line tool. The free version is suitable for individual developers, while the paid plans offers the advanced features for teams and enterprises.
cURL #
Use cURL for command-line HTTP requests server to server
cURL stands for “Client for URLs” and is a command-line tool that allows you to send HTTP requests from the terminal. It is usually pre-installed on Unix-based systems like Linux and macOS.
You can use cURL to make requests with different methods, headers, and bodies, and view the raw response from the server. cURL is useful for scripting and automation tasks, as well as debugging network issues.
It is often used when you only have command-line access to a server, such as with ssh, and need to make test or diagnotic requests. This common when a web service is provided by group of servers that communicate with each other, but disallow external access. Curl can be used to test that api calls are accessible and working as expected, indendently of the web applications.

Wireshark #
Use Wireshark for low-level network traffic analysis
Wireshark is a network protocol analyzer that allows you to capture and inspect network traffic in real-time. You can use Wireshark to monitor HTTP requests and responses between clients and servers, and analyze the data being transferred over the network. ** Wireshark is mostly used by advanced users and network administrators as it provides low-level details such as packet headers and payloads, which is mostly unnecessary for regular web development tasks. However, it can be useful for diagnosing network issues such as network connection issues, latency, and packet loss.
