Java Stack Traces: How to Read Errors and Debug Your Code
Table of Contents

What is a Stack Trace? #
Exceptions in Java come with a stack trace that helps you understand what went wrong and where in your code it happened.
Put simply, it’s a list of method calls (frames) that show how your program reached the error that was thrown. It is generated at the point where an exception is thrown.
throw new NullPointerException("This is a null pointer exception");
When this line of code is executed, Java will generate a stack trace that looks like this:
Exception in thread "main" java.lang.NullPointerException

    at com.example.MyClass.myMethod(MyClass.java:10)
    at com.example.MyClass.main(MyClass.java:5)
Anatomy of a Java Stack Trace #
A Java stack trace typically consists of several key components:
- Exception Type and Message: The first line of the stack trace indicates the type of exception that was thrown (e.g.,
NullPointerException,ArrayIndexOutOfBoundsException) along with an optional message that provides additional context about the error. - Stack Frames: Each subsequent line represents a stack frame, which includes:
- The fully qualified name of the class where the method is located.
- The method name.
- The source file name and line number where the exception occurred.
Here is a simple class that generates a stack trace on purpose.
package com.programmerpulse.stacktrace;

public class MyClass {

    public static void main(String[] args) {
        int index = 3; // comes from main (could also be parsed from args)
        runBusinessLogic(index);
    }

    public static void runBusinessLogic(int index) {
        loadData(index);
    }

    public static void loadData(int index) {
        int[] numbers = {10, 20, 30};
        int value = numbers[index]; // throws ArrayIndexOutOfBoundsException when index is 3
        System.out.println("Unreachable: " + value);
    }
}
When you run this code, it will produce the following stack trace:
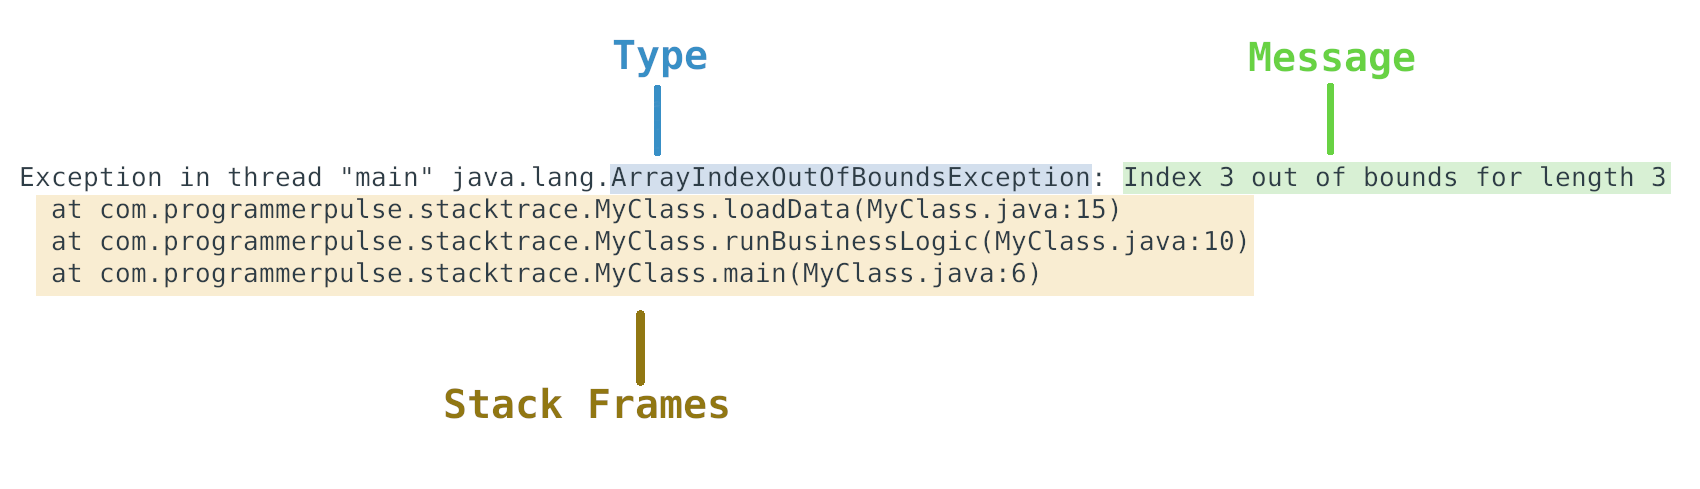
After the first line, which shows the exception type and message, each line represents a method call in the call stack at the time the exception was thrown.
The first stack frame:
at com.programmerpulse.stacktrace.MyClass.loadData(MyClass.java:15)
indicates that the exception occurred in the loadData method of the MyClass class, specifically at line 15 of the MyClass.java source file.
However, there is not enough information here to determine the root cause of the error. We need to look further down the stack trace to see how we got to this point, which, according to the next lines, came from the runBusinessLogic method, which was called from the main method.
This is typically how you would read a stack trace to trace back the sequence of method calls that led to the exception.
Chaining Exceptions (caused by) #
You may have noticed that some stack traces include a “caused by” section. This indicates that the exception was caused by another underlying or low-level exception.
Never swallow exceptions
One of the best practices in Java exception handling is to never swallow exceptions or re-throw them as another exception without preserving the original cause.
This is bad practice.
    try {
        // code that reads data from a file
    } catch (IOException e) {
        throw new DataProcessingException("Failed to process data from file");
    }
It hides the original exception and makes it harder to debug the root cause of the error.
Instead, create exception classes that also accept a cause in their constructor and use that to chain exceptions together.
public class DataProcessingException extends Exception {
    /** Constructor with just a message */
    public DataProcessingException(String message) {
        super(message);
    }

    /** Constructor that also sets the cause */
    public DataProcessingException(String message, Throwable cause) {
        super(message, cause);
    }
}
Use the cause constructor to wrap the original exception when you catch it.
public void processData(String filePath) throws DataProcessingException {
    try {
        // code that reads data from a file
    } catch (IOException e) {
        throw new DataProcessingException("Failed to process data from file: " + filePath, e);
    }
}
Now, the stack trace will include both the DataProcessingException and the original IOException.
With exception chaining, the stack trace may look like this:
Exception in thread "main" com.programmerpulse.stacktrace.DataProcessingException: Error reading data from file
	at com.programmerpulse.stacktrace.DataReader.processData(DataReader.java:26)
	at com.programmerpulse.stacktrace.DataReader.main(DataReader.java:12)
Caused by: java.nio.file.NoSuchFileException: data.txt
	at java.base/sun.nio.fs.UnixException.translateToIOException(UnixException.java:92)
	at java.base/sun.nio.fs.UnixException.rethrowAsIOException(UnixException.java:106)
	at java.base/sun.nio.fs.UnixException.rethrowAsIOException(UnixException.java:111)
	at java.base/sun.nio.fs.UnixFileSystemProvider.newByteChannel(UnixFileSystemProvider.java:218)
	at java.base/java.nio.file.Files.newByteChannel(Files.java:380)
	at java.base/java.nio.file.Files.newByteChannel(Files.java:432)
	at java.base/java.nio.file.Files.readAllBytes(Files.java:3288)
The first exception is the business-level DataProcessingException that provides context about the error, while the lower-level NoSuchFileException provides the root cause of the error: the file data.txt was not found.
If you only had the DataProcessingException without the cause, you would not know that the root cause was a missing file.
If you only had the NoSuchFileException without the context of the DataProcessingException, you would not know that the error occurred while trying to process data from a file.
Both exceptions together provide a complete picture of the error, where and why.
How to Read a Stack Trace Step-by-Step #
Now that you have an idea of the structure of a stack trace, here are some steps to help you read and understand it effectively:
- Start with the First Line: The first line of the stack trace provides the type of exception and an optional message. This gives you an initial clue about what went wrong.
Don’t read the whole stack trace at once, zero in on the relevant parts that point to your code.
-
Find your code in the Stack Frames: Look for stack frames that reference your own code (as opposed to library or framework code). These frames will typically include your package name and class names and the line numbers where the exception occurred.
-
Identify the earliest point in your code where things went wrong: This is usually the highest stack frame that references your code, maybe just after a bunch of library code. This is the point where you should start your investigation.
Finding the
whyit occurred is often all you need to fix the issue.
- Inspect cause vs wrapper exceptions: If the stack trace includes multiple exceptions (e.g., caused by), start with the root cause exception, the last exception. This will immediately point you to the underlying issue, the
whyof the error. Then you can look at the other exceptions up the stack to understand the context of the error, thewhereandhowof the error.
Common Mistakes with Stack Traces #
Some common mistakes that junior developers make when reading stack traces include:
Assuming the error is in the library code #
The error must be in the Java API/Library because the stack trace shows java.util or Spring classes.
This does not necessarily mean that the error is in the library code. It could be that your code is calling a library method with invalid arguments, which then throws an exception. Hopefully, well-designed libraries will throw exceptions with clear messages that point to the root cause of the error, but this is not always the case, and you may need to consult the library documentation or source code to understand why the exception was thrown.
Looking at the bottom of the stack trace first #
I should fix the code at the bottom of the trace first
For a single (non-chained) exception, the bottom of the stack trace often just shows the program start. The important part is the top of the stack trace, which shows the point where the exception was thrown.
For chained (caused by) exceptions, the bottom of the stack trace (the last exception) is the root cause of the error, and this is where you should start your investigation. Then, after the last exception message line, start looking at the stack frames beneath it.
Misinterpreting the “Exception in thread” message #
Exception in thread “main” is an error I need to handle separately.
The “Exception in thread “main”” is just a standard prefix that Java uses to indicate which thread crashed. The ‘main’ thread is the primary thread that your program runs on. It’s not something you fix, it’s just a label. The important part is the exception type and message that follows it, and the stack frames that show where the error occurred in your code.
Not printing the full stack trace #
e.getMessage() is enough to understand the error.
Junior developers often make the mistake of only printing the exception message without the stack trace, which makes it much harder to debug the issue, especially if the message is not descriptive enough. Always print the full stack trace when logging exceptions, using e.printStackTrace() or a logging framework that includes stack traces in its output.
If you are re-throwing exceptions, make sure to include the original exception as the cause, so that the stack trace will include the full chain of exceptions and provide more context for debugging. See the section on “Chaining Exceptions” above for more details on how to do this properly.
Conclusion #
Do not fear stack traces; they are your friend.
Stack traces are usually essential for debugging complex issues in Java applications. Whenever you are given a problem or issue to fix, ask for any related stack traces. Sometimes that is all you need to understand the root cause of the issue.
Once you learn how to read stack traces effectively, you will also learn how to write more informative exceptions and error messages in your own code.